|
Time to learn more about the current status of goaltenders in the NHL with our latest investigation! 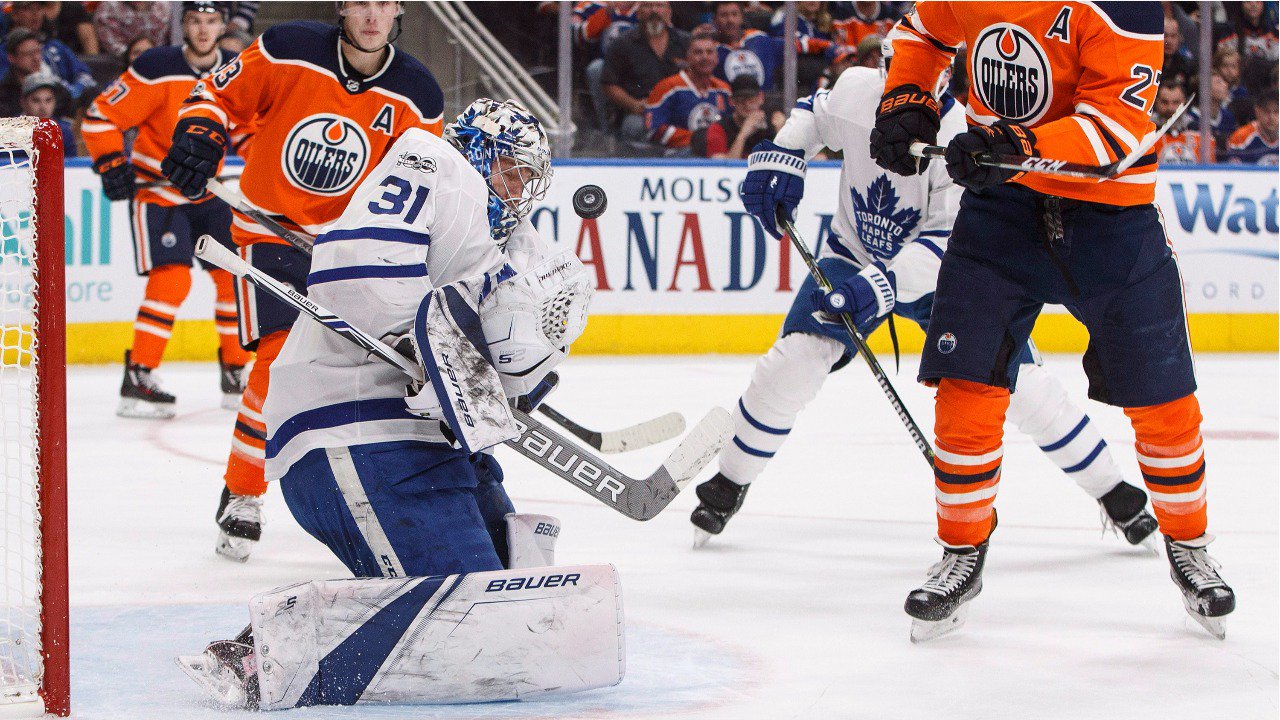 @SNStats What are we measuring here? We want to know if the amount of goals against has to do with the amount of shots against for a goaltender. For this investigation, the top ten goaltenders in goals against were used along with their numbers for shots against. Top Ten (from hockey-reference.com): Frederik Andersen (TOR)- 64 GA, 786 SA Cam Talbot (EDM)- 61 GA, 629 SA Matthew Murray (PIT)- 58 GA, 617 SA John Gibson (ANA)- 57 GA, 715 SA Henrik Lundqvist (NYR)- 57 GA, 684 SA Craig Anderson (OTT)- 56 GA, 504 SA Jake Allen (STL)- 55 GA, 589 SA Mike Smith (CGY)- 54 GA, 713 SA Jimmy Howard (DET)- 53 GA, 621 SA Robin Lehner (BUF)- 52 GA, 537 SA Devan Dubnyk (MIN)- 52 GA, 592 SA Brian Elliott (PHI)- 52 GA, 548 SA Ben Bishop (DAL)- 52 GA, 581 SA 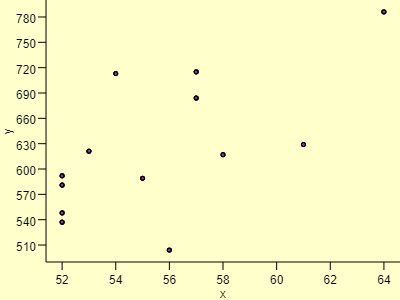 Observed r: 0.624 Association: Positive Strength: Moderate True correlation between goals against and shot attempts is positive because 2% were above the observed r of 0.624 presented above. So this means that there is a good chance that these two variables are related! 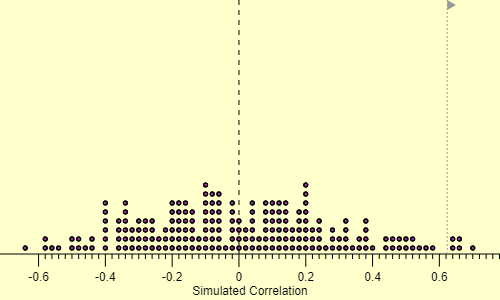 With a larger sample size, we will know if they truly are correlated BUT this is a start.
Today's investigation will take a look into the NFL's top defense right now, including their average yards given up per game and how they stack up against the rest of the league. 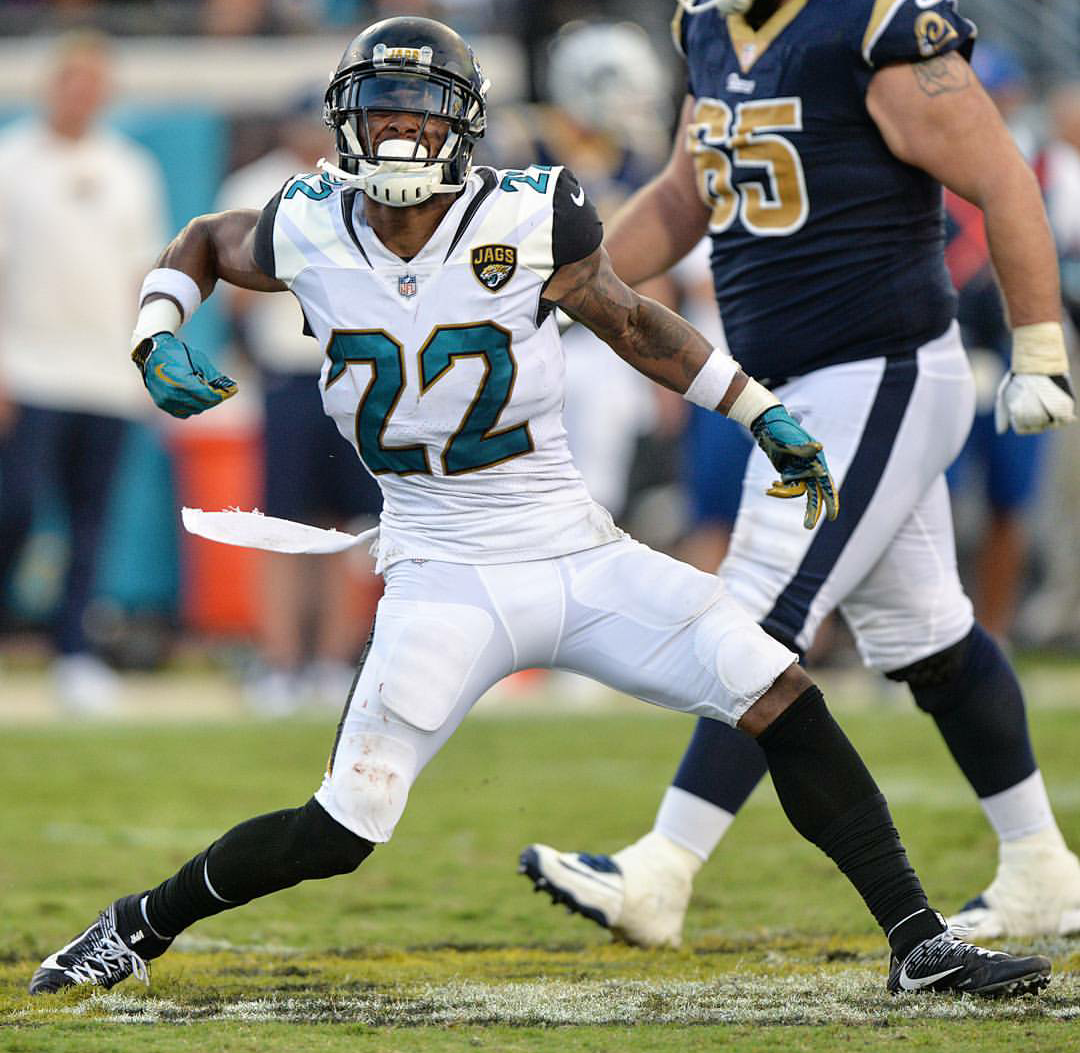 @jaguars
What is a confidence interval again?: A series of simulations to see how close a team or athlete is to their ability. These are 95% accurate, and today's involves two means that are featured above. Confidence Interval Results: The Jaguars have the ability to allow more than 219.12 yards away while allowing less than 339.62 at home. Z-Scores for Total Yards Given Up: League Average for Yards Given Up- 3093.47 Jacksonville's Z-Score: -1.53 (2572 yards) Why this is good: Jacksonville is 1.53 standard deviations away from the league-average, which is as far as it gets for the league. To put this into perspective, the worst defense (Indianapolis Colts) is 2.24 standard deviations above what a team should give up for yardage. Jacksonville's defense gives up an average of 14.9 points per game while Cleveland's offense scores about 15.9 points per game. It could swing in Jacksonville's favor, or Cleveland could stop the three-game win streak tomorrow.
Hello, everyone! It's been two weeks since we last looked at stats, but this is back! Baseball season was great, and the stats behind it all were so fun to look at, but there are other sports taking over right now. Today's stats will center (or centre) around the top teams in hockey based on who leads their division right now. In this, you will see why these teams are successful, and you will also find out who is the best in the different areas.
Tampa Bay Lightning, Atlantic 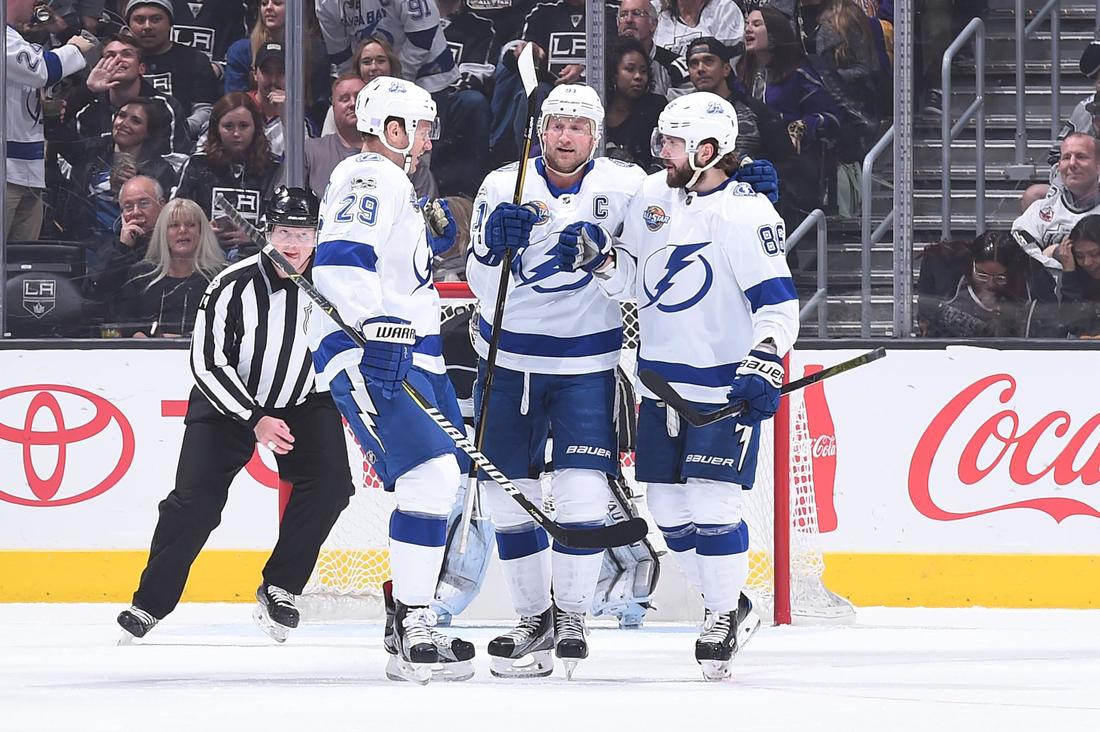 @PR_NHL Points: 28 Goals For: 69 Goals Against: 45 Strength of Schedule*: -0.03 Power Play Success: 27.94% Penalty Kill Success: 83.87% How that stacks up against the league- Goals For: +20 Goals Against: -4 Power Play Success: +9.03% Penalty Kill Success: +2.78% St. Louis Blues, Central 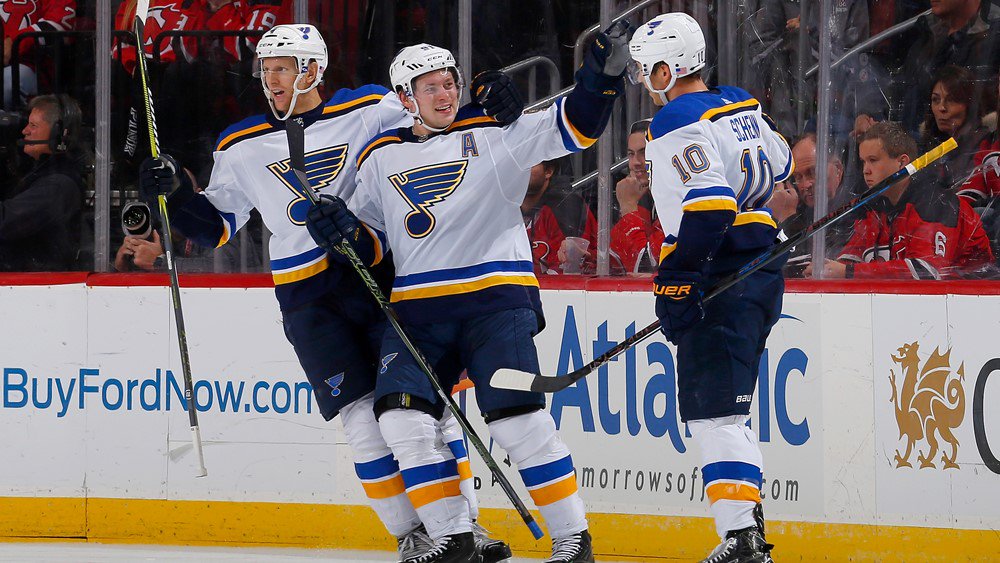 @PR_NHL Points: 27 Goals For: 56 Goals Against: 39 Strength of Schedule*: 0.12 Power Play Success: 15.79% Penalty Kill Success: 79.31% How that stacks up against the league- Goals For: +7 Goals Against: -10 Power Play Success: -3.12% Penalty Kill Success: -1.78% New Jersey Devils, Metropolitan 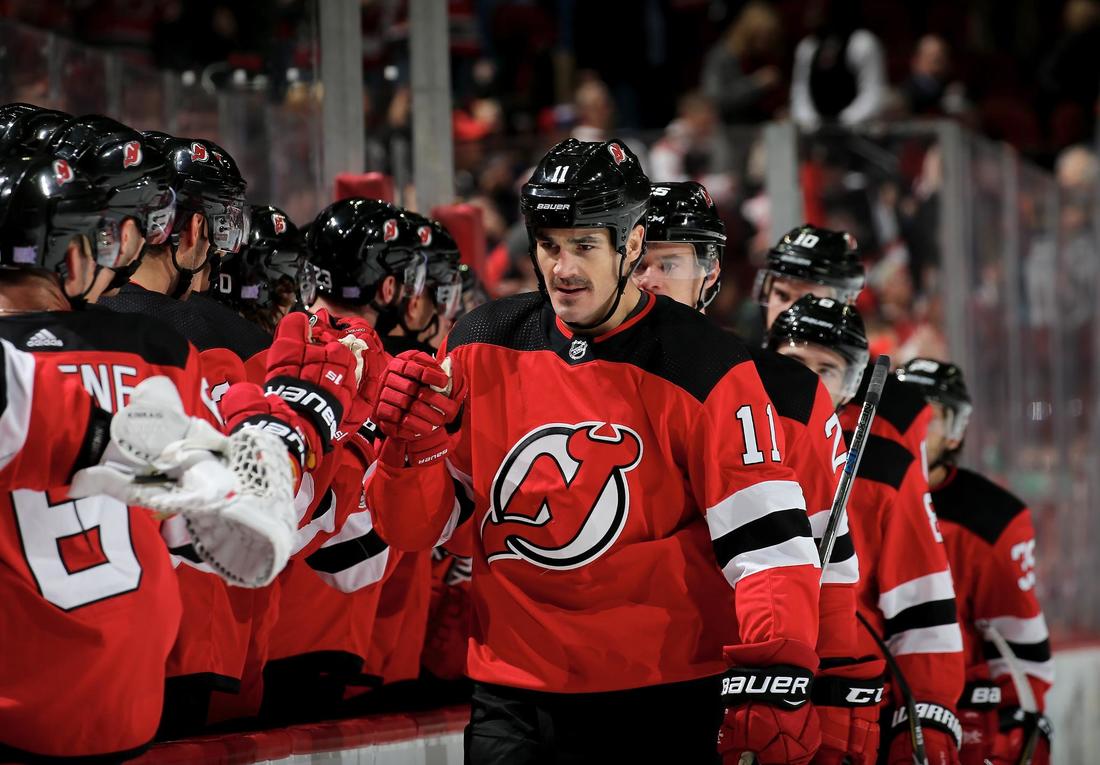 @PR_NHL Points: 20 Goals For: 52 Goals Against: 48 Strength of Schedule*: -0.05 Power Play Success: 21.57% Penalty Kill Success: 81.25% How that stacks up against the league- Goals For: +3 Goals Against: +1 Power Play Success: +2.66% Penalty Kill Success: +0.16% Pittsburgh Penguins, Metropolitan  @PR_NHL Points: 20 Goals For: 46 Goals Against: 63 Strength of Schedule*: -0.03 Power Play Success: 26.09% Penalty Kill Success: 80.28% How that stacks up against the league- Goals For: -3 Goals Against: -14 Power Play Success: +7.18% Penalty Kill Success: -0.81% Los Angeles Kings, Pacific 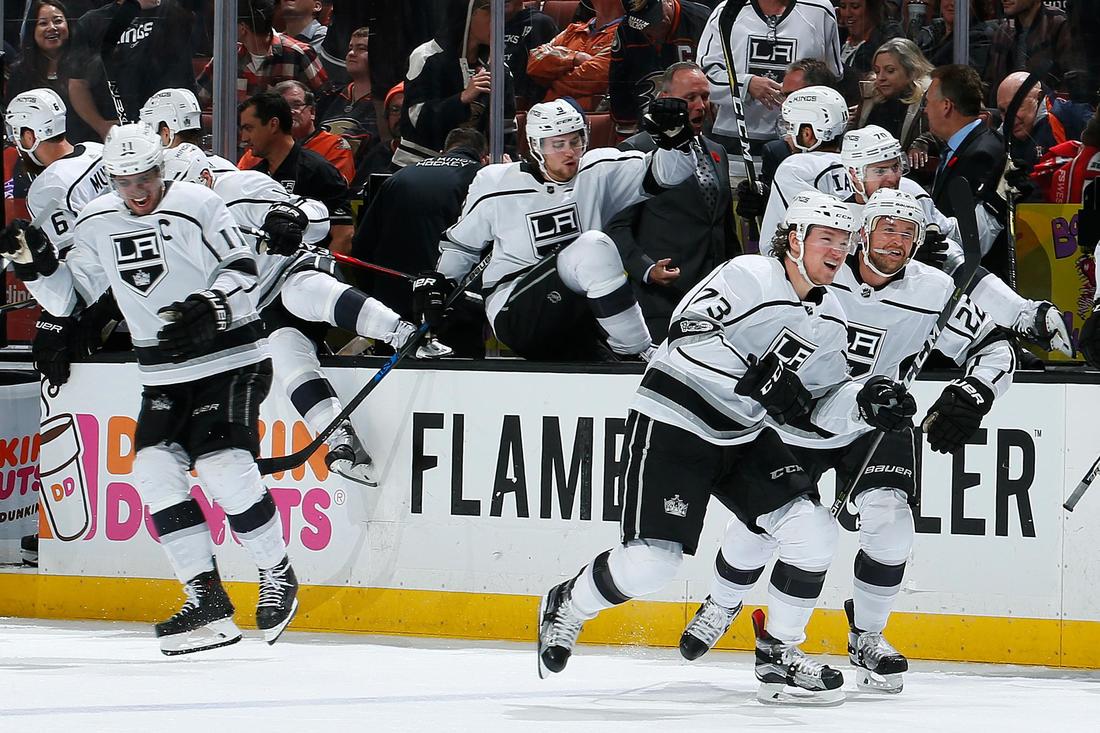 @PR_NHL Points: 24 Goals For: 54 Goals Against: 39 Strength of Schedule*: 0.11 Power Play Success: 17.86% Penalty Kill Success: 91.53% How that stacks up against the league- Goals For: +5 Goals Against: +10 Power Play Success: -1.05% Penalty Kill Success: +10.44% Hope this was a good thing for your Saturday/Hockey Night!
How important is today's game four?
Very important, if you look back at the past ten World Series games. I won't go too into detail why because that's what the graphic was created for, but at least six teams who lost the game at home went on to lose the World Series. The winners are few and far between as well, but two out of the three who won at home did win the World Series. With that being said, here is why tonight is important: Tonight's game decides the burning question of who will be in the 2017 World Series. While we cannot wait for this event coming up in a few hours, we can pass the time by looking over at the two pitchers and their stats for tonight. 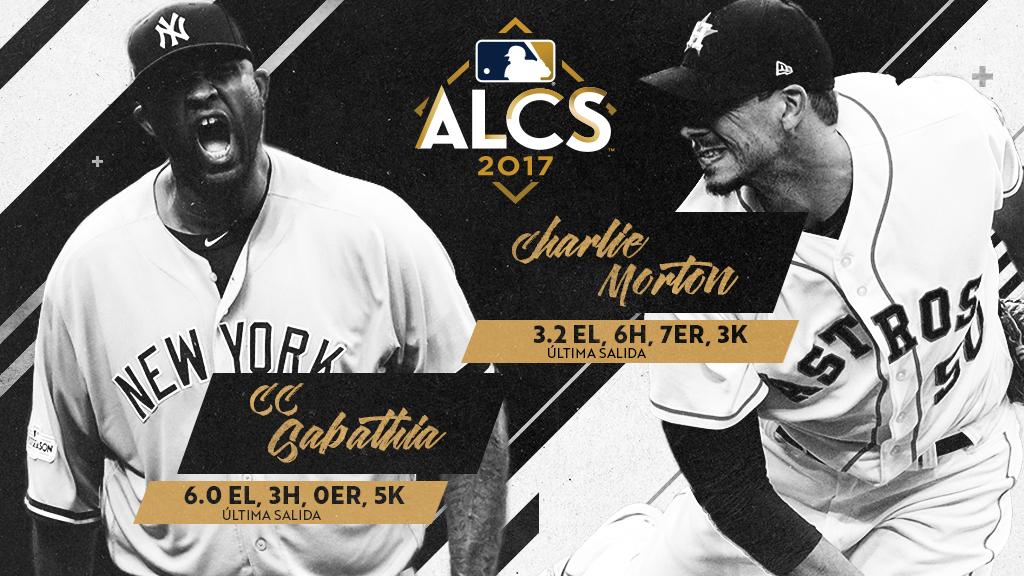 @lasmayores Let's start with the visiting New York Yankees... 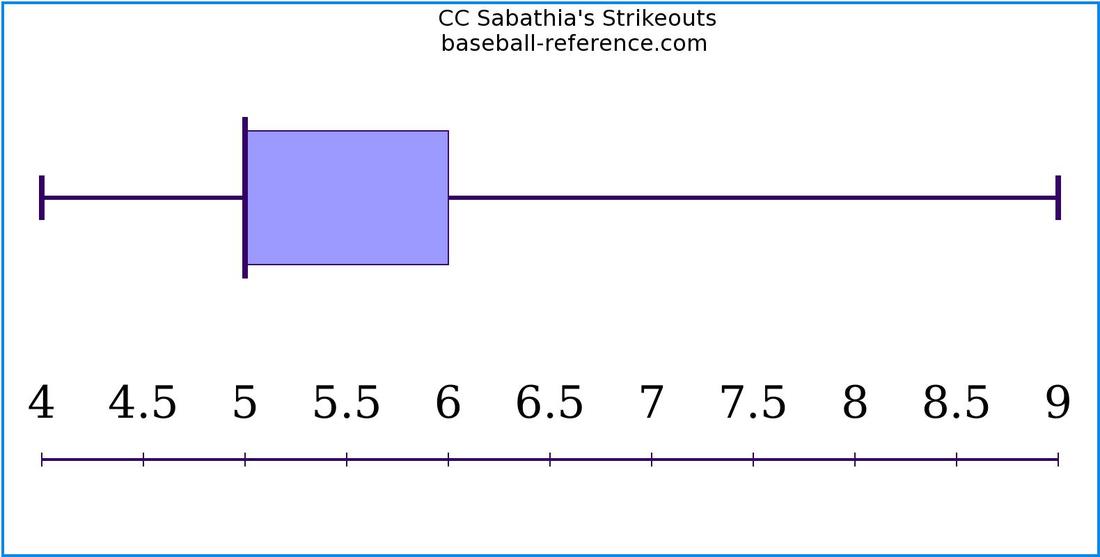 Mean: 5.7 Standard Deviation: 1.6 Median: 5 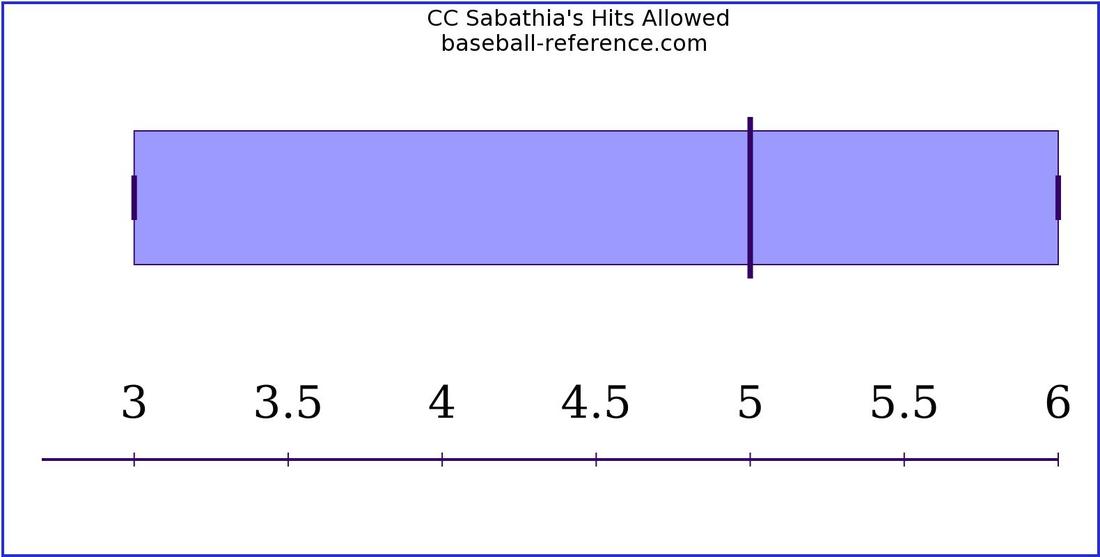 Mean: 4.7 Standard Deviation: 1.4 Median: 5 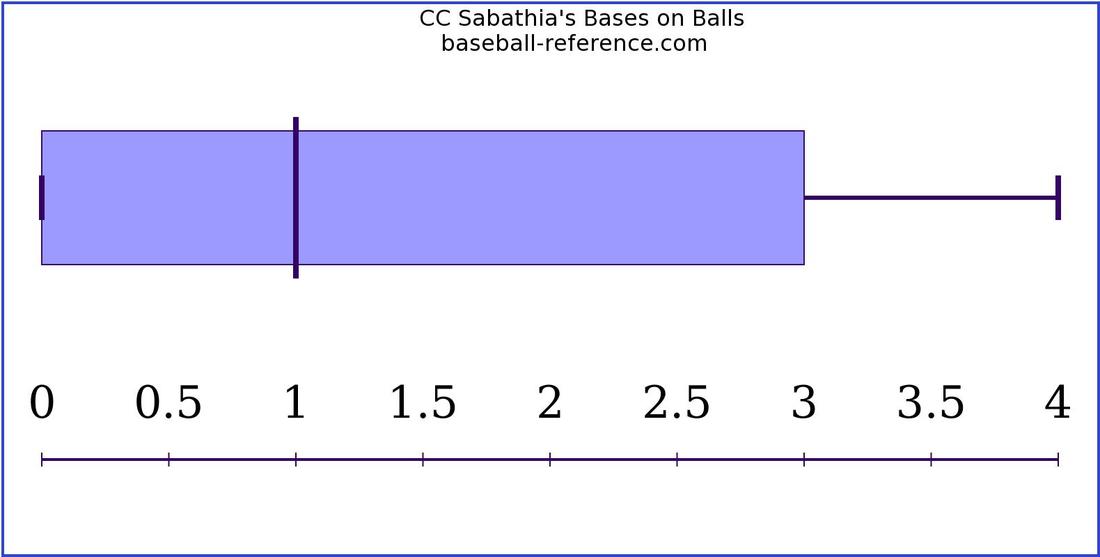 Mean: 1.6 Standard Deviation: 1.5 Median: 1 And continue with the Houston Astros... 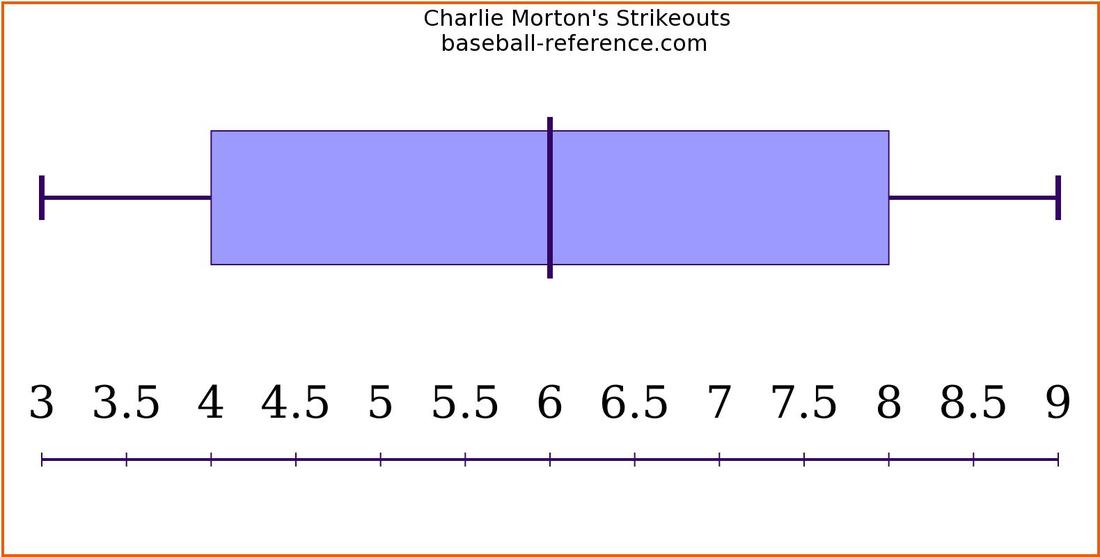 Both charts were created on meta-chart.com. Mean: 6 Standard Deviation: 2.2 Median: 6 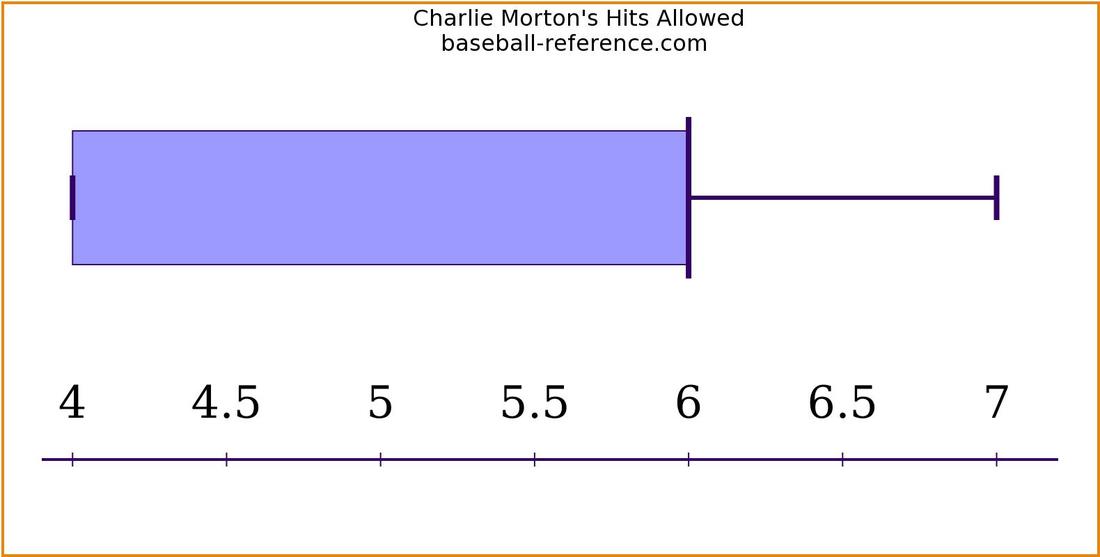 Mean: 5.4 Standard Deviation: 1.1 Median: 6 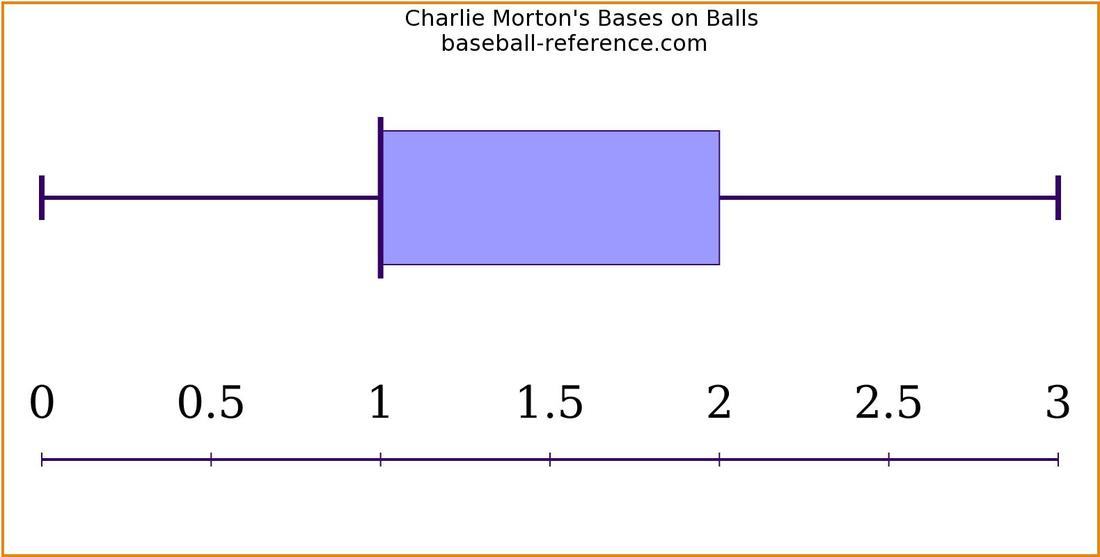 Mean: 1.4 Standard Deviation: 0.98 Median: 1 Conclusion-
Sabathia has less strikeouts than Morton but he allows less hits than Morton does. Morton is slightly better at controlling the amount of walks he gives out but these pitchers are nearly equal. Sabathia won last time they faced each other but Houston has good momentum coming into this home game and that will make this a close one. Hopefully the result will be a good one! See you soon! Happy Championship Series time! We are that much closer to learning who will represent each league in the World Series. Today's simulation will show how better a team is at scoring runs at home vs. on the road. Los Angeles Dodgers 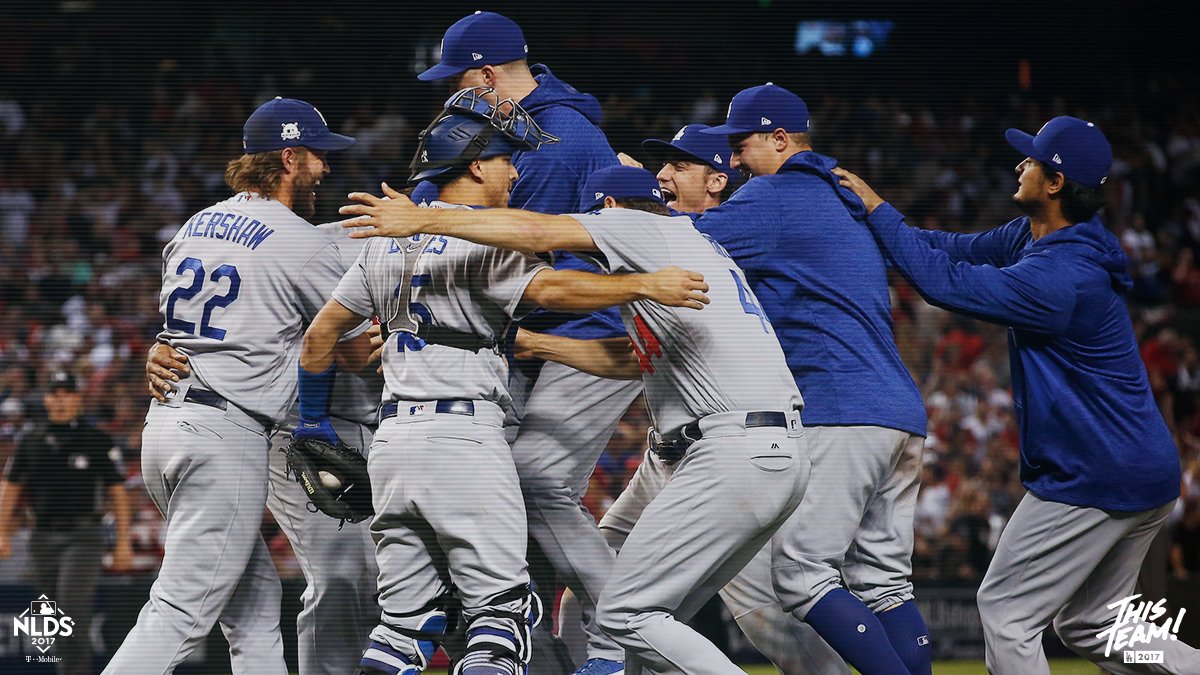 @dodgers Home Mean: 7 runs Road Mean: 1 run The Dodgers are able to score 7.1 more runs at home and 1 fewer run on the road. Chicago Cubs 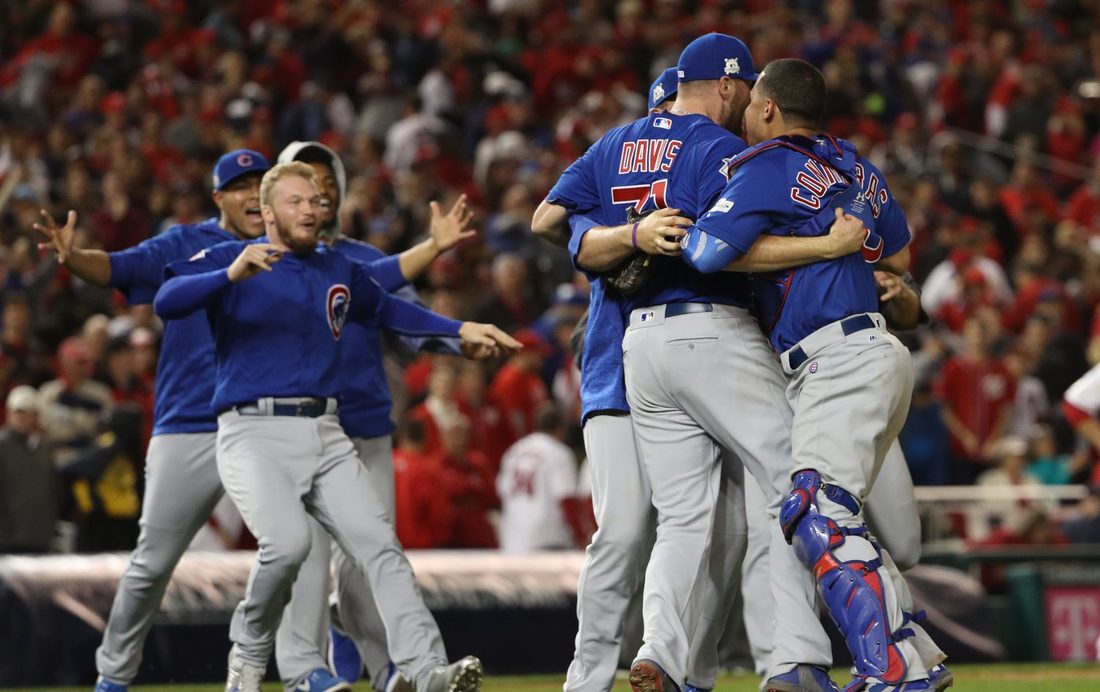 @zesty_cubs Home Mean: 3.5 Road Mean: 5 The Cubs are able to score 9.1 fewer runs at home than 6.1 more runs on the road. New York Yankees 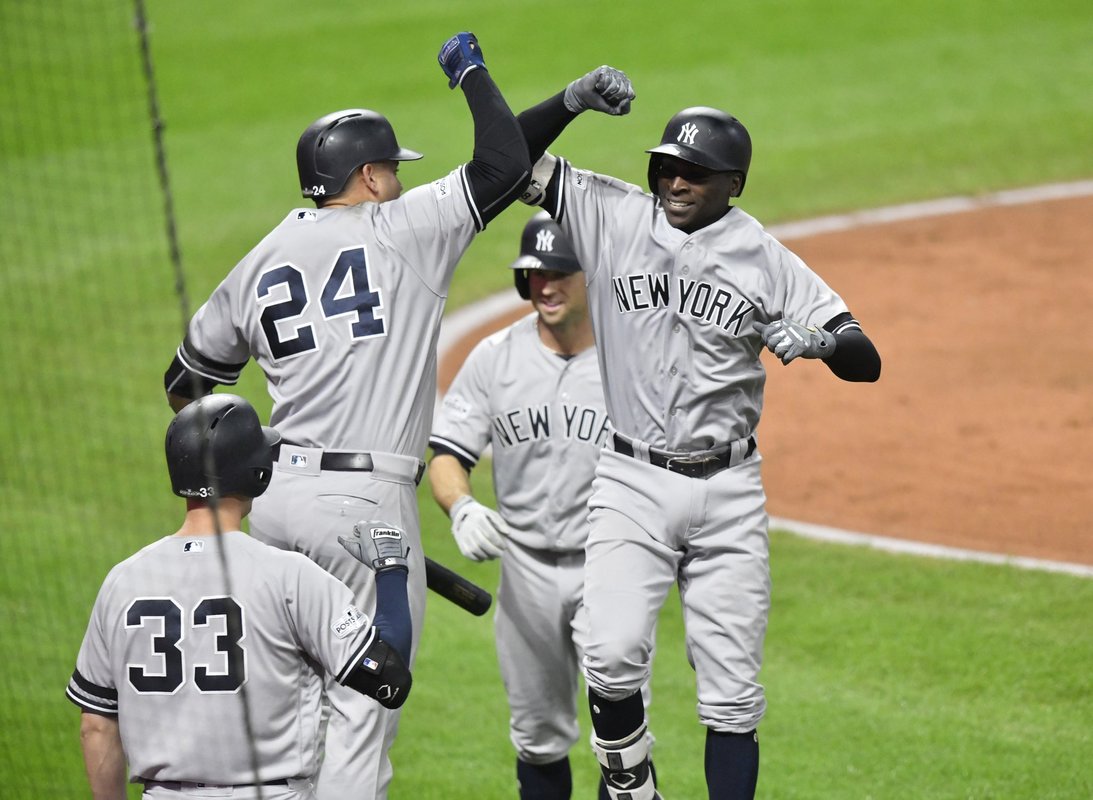 @BleacherReport Home Mean: 4 Road Mean: 4.3 The Yankees are able to score less than 7.8 runs at home and more than 7.2 runs on the road. Houston Astros 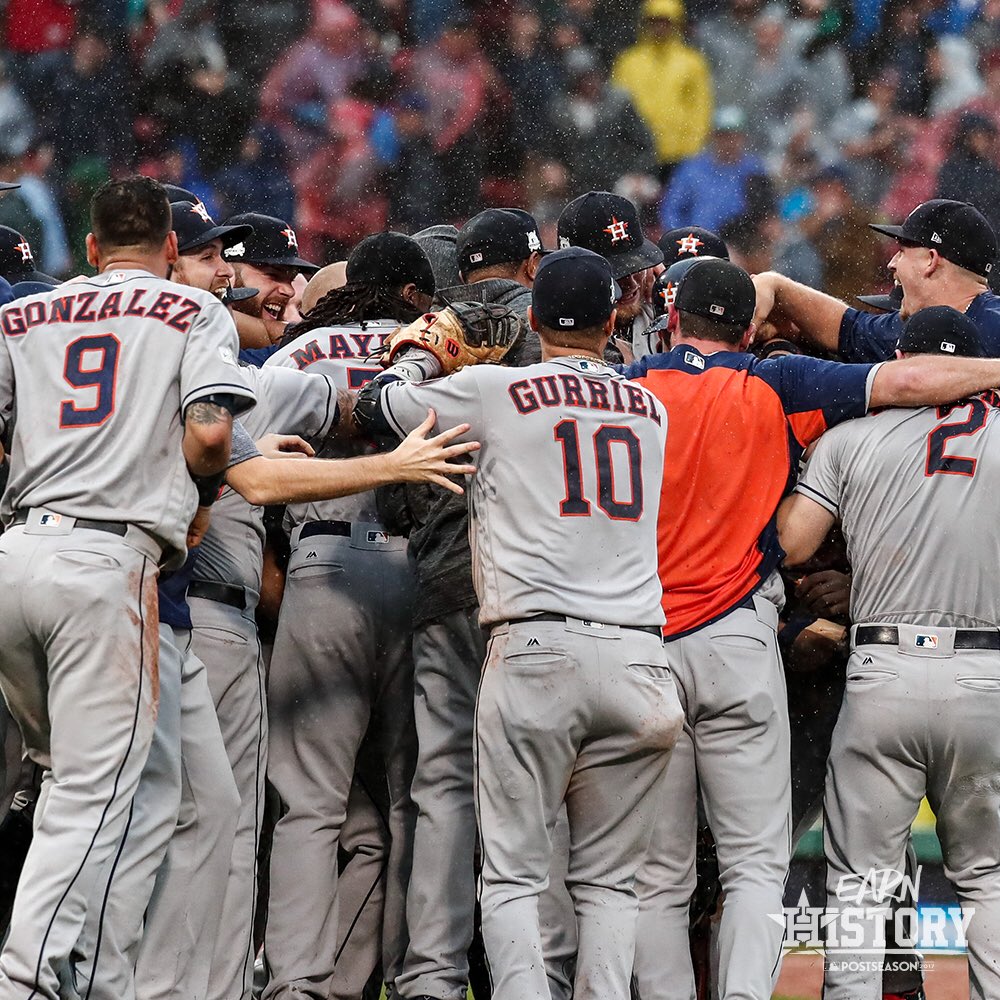 @astros Home Mean: 8 Away Mean: 4 The Astros are able to score 5.9 more runs at home and 2 fewer runs on the road. Stats were taken from the Division Series only. Last night's game was not put in for this.
Last night, Clayton Kershaw received his first postseason win at Dodger Stadium against the Arizona Diamondbacks. His postseason career began in 2008 but it hasn't been as successful as he wanted it to be until 2015 where he has not lost since. Today's simulation will focus on if he has the same ability in the postseason as his regular season ability. We know what he is capable of there, so let's see if it translates here. 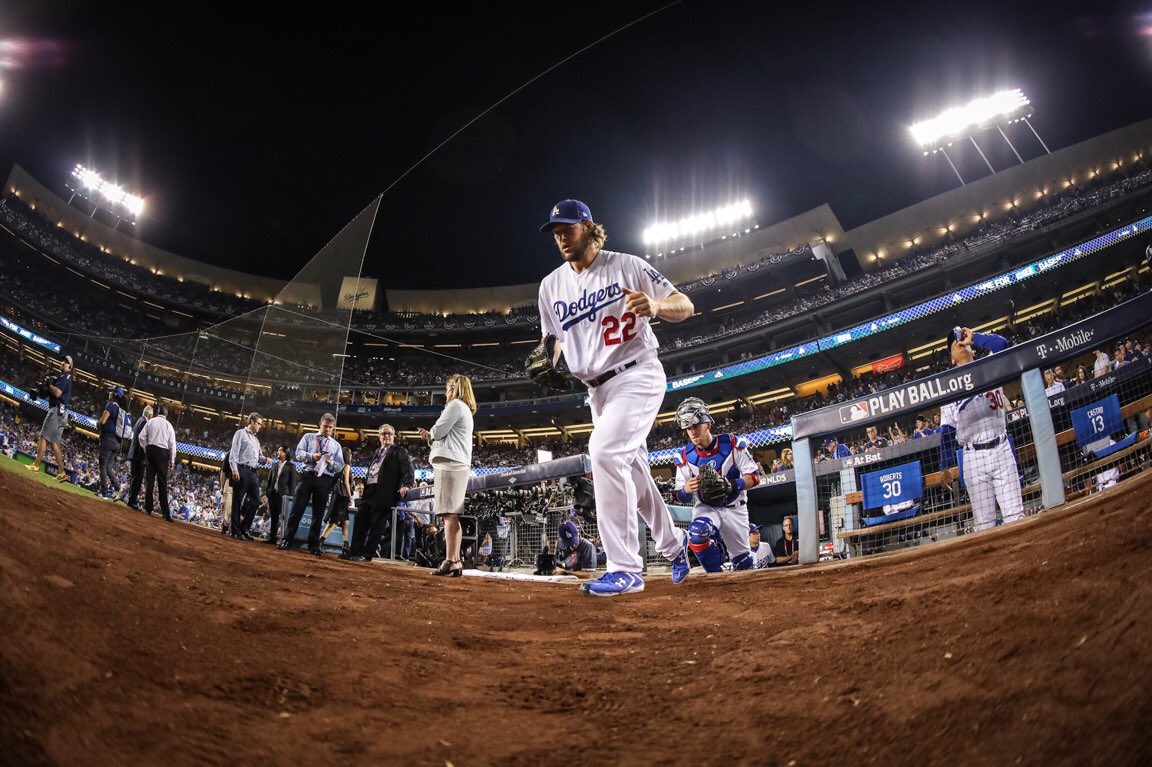 @dodgers Simulation Z-Score: 38/200, or 19% His ability in the playoffs is not different from his ability in the regular season, even though the numbers here are very close. 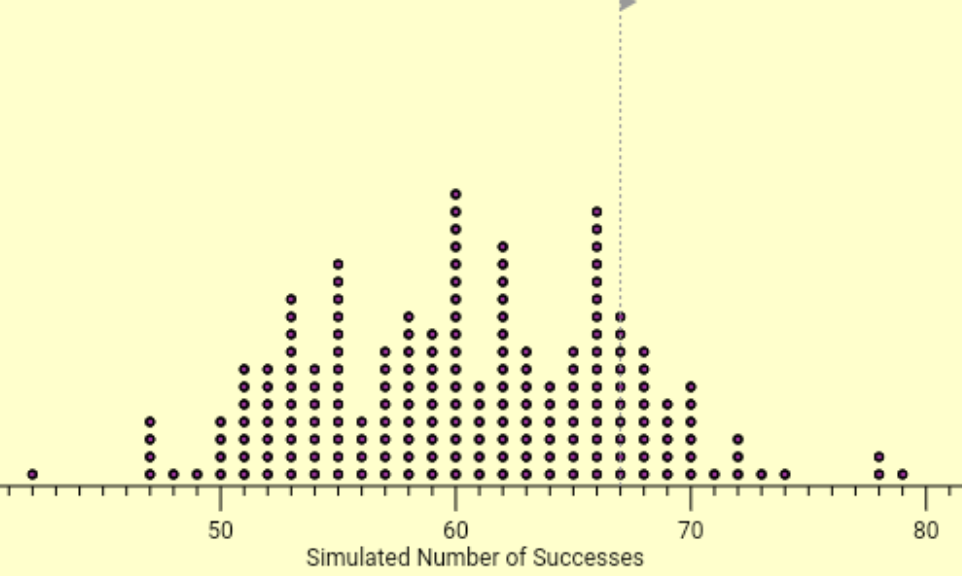 whfreeman.com/SRIS He may not look his greatest in the postseason, but Kershaw cleaned up his act in his past few outings. That's all that the Dodgers can ask for as they take a good shot at the World Series this year.
Watch them as they take on Arizona tonight at 9 pm ET. This year has the most home runs we have ever seen in the Majors and as a closing thought for the regular season, it would be great to see how they compare to 2000, one of the best years to hit home runs (most in the National League that year at 3,005). We will do so by simulating the difference in both means and medians to see if their differences are that significant.  @ESPNStatsInfo
Difference in Means: The simulated difference between the mean number of home runs will be our guide in this simulation. We have to look for -3 or 3 and if less than 5% predicted a gap of 3, the 2017 hitters have a greater ability to hit home runs. 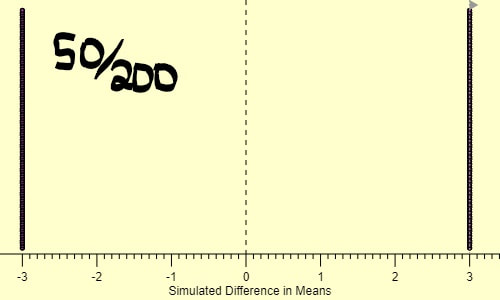 With 50/200, we still do not have enough evidence to support that the 2017 hitters had a greater ability to hit more home runs. Difference in Medians: The difference this time is -5 or 5 and we have to see if there is a small percentage where it is possible that 2017 had better home run totals. The median method is good if you have any outliers and there are not any that stick out too much, but it still provides an accurate representation. 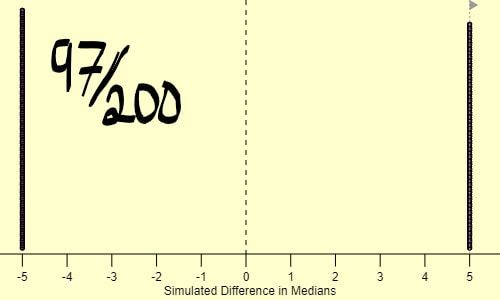 At 97/200, there is not enough evidence to support that the 2017 hitters had better home run totals. This season may have the most home runs in both leagues combined, but the averages and medians cannot compare to 2000. We may have Stanton, but they have consistency in their totals and everyone is relatively close to each other. This year was amazing to watch home run-wise and I would not trade it for anything else.
Wild Card season is only heating up as we near the end next week. Maybe we will know who will make it next week or maybe we will be left on a cliffhanger for the last game of the season. Today will focus on the chances of each team winning in home vs. road games since every win counts right now. What the numbers mean: The negative number is how many fewer wins they have on the road vs. how many more wins they have at home. This was found by taking their home and away splits and plugging them into a formula for the answer. National League: Arizona Diamondbacks  @dbacks Confidence Interval: -3.45 to 3.72 Magic Number: 2 Schedule: At home vs. Miami and San Francisco and finish on the road at Kansas City. Colorado Rockies  @rockies Confidence Interval: -1.74 to 1.87 Magic Number: 8 Schedule: At San Diego, then a homestand with Miami and Los Angeles. Milwaukee Brewers:  @travis_shaw21 Confidence Interval: -0.1 to 1.05 Schedule: Homestand vs. Chicago and Cincinnati, then on the road at St. Louis. St. Louis Cardinals  @cardinals Confidence Interval: -1.58 to 1.73 Schedule: At Pittsburgh, then a homestand with Chicago and Milwaukee. American League: New York Yankees  Confidence Interval: -2.83 to 3.09 Magic Number: 1 Schedule: At Toronto, then at home with Kansas City, Tampa Bay, and Toronto. Minnesota Twins  @twins Confidence Interval: -1.01 to 0.93 Magic Number: 6 Schedule: At Detroit, then vs. Cleveland and Detroit at home. Los Angeles Angels of Anaheim  @angels Confidence Interval: -0.97 to 1.09 Schedule: At Houston and Chicago, then vs. Seattle at home. Texas Rangers  @rangers... again Confidence Interval: -0.97 to 1.09 Schedule: At Oakland, then at home vs. Houston and Oakland. May The Odds Be Ever In Your Favor.
Instead of doing simulations today, I decided to help you (and myself) further understand a confusing statistic that gets thrown around a lot. If you guessed WAR (Wins Above Replacement), then you are correct! If you already understand this, follow along to see if this is a good explanation. Here we go:
|
AuthorHi, I'm Jenna and I'm a sports fan! I've been avidly watching sports since 2011 because I found that by watching sports, I would be able to communicate with my dad and brother better. Ever since I got into sports, I've been able to enjoy myself more when I go to sporting events with my family. Archives
December 2017
Categories
All
|
 RSS Feed
