|
This year has the most home runs we have ever seen in the Majors and as a closing thought for the regular season, it would be great to see how they compare to 2000, one of the best years to hit home runs (most in the National League that year at 3,005). We will do so by simulating the difference in both means and medians to see if their differences are that significant.  @ESPNStatsInfo
Difference in Means: The simulated difference between the mean number of home runs will be our guide in this simulation. We have to look for -3 or 3 and if less than 5% predicted a gap of 3, the 2017 hitters have a greater ability to hit home runs. 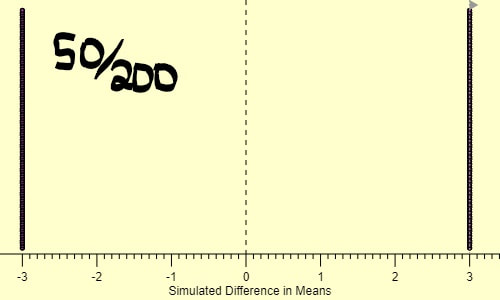 With 50/200, we still do not have enough evidence to support that the 2017 hitters had a greater ability to hit more home runs. Difference in Medians: The difference this time is -5 or 5 and we have to see if there is a small percentage where it is possible that 2017 had better home run totals. The median method is good if you have any outliers and there are not any that stick out too much, but it still provides an accurate representation. 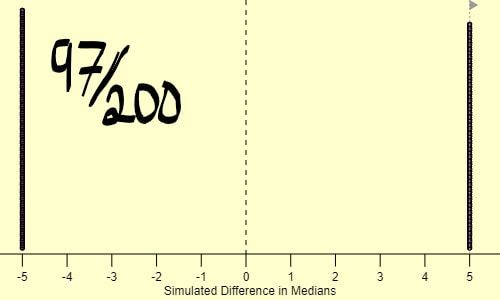 At 97/200, there is not enough evidence to support that the 2017 hitters had better home run totals. This season may have the most home runs in both leagues combined, but the averages and medians cannot compare to 2000. We may have Stanton, but they have consistency in their totals and everyone is relatively close to each other. This year was amazing to watch home run-wise and I would not trade it for anything else.
Leave a Reply. |
AuthorHi, I'm Jenna and I'm a sports fan! I've been avidly watching sports since 2011 because I found that by watching sports, I would be able to communicate with my dad and brother better. Ever since I got into sports, I've been able to enjoy myself more when I go to sporting events with my family. Archives
December 2017
Categories
All
|
 RSS Feed
